
|
Graphs showing how much better than Republicans Democrats are for our National Economy |
| Pages : 1 2 of graphs |
| [ http://LiberalsLikeChrist.org/+Reasonable/graphs.html ]
|
|
U.S. racks up record trade deficit in 2005 $725.8 billion total is 17.5% increase over 2004's mark ; "The United States racked up a record-high trade deficit with the rest of the world in 2005, setting off a political firestorm that's being felt from Washington to Beijing, roiling U.S. manufacturers and organized labor, and prompting Congress to consider new laws to rein in the losses." [ Source = San Franciso Chronicle ] |
|
|
Bush vs other presidents on job growth post WWII. Source: Bureau of Labor and Statistics (www.bls.gov). With the exception of Reagan's 2nd term, Democratic administrations have proven to be invariably better than Republican administrations for job growth. |
|
The Nation's Financial Well-being |
|
The Nation's Financial Well-being |
|
The Nation's Financial Well-being
|
|
Impact on the Richest and Most Invested,
|
|
Impact on the Richest and Most Invested |
|
Graph Sources:
| |
| Under the Bush administration, the United States has fallen to sixth place in the World Economic Forum's 2006 global competitiveness rankings, ceding the top place to Switzerland :
1. Switzerland www.commondreams.org/headlines06/0926-02.htm |
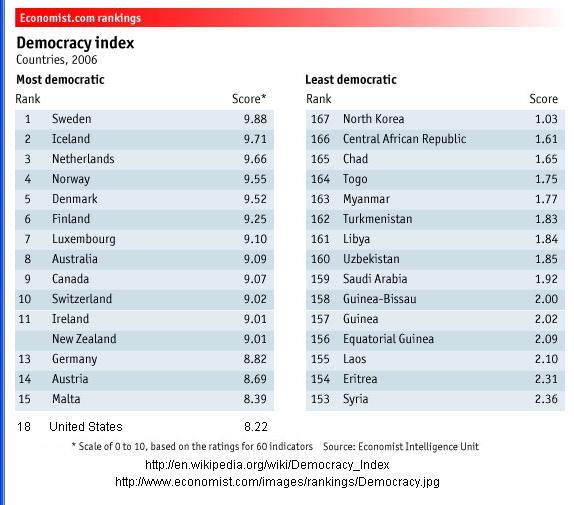
Nations with the least corrupt governments: Funny how the world's more liberal countriestend to be the ones with the least corruption !
the less likely they are to be high on the list of political integrity ! See www.transparency.org/news_room/in_focus/cpi_2006/cpi_table. On the world scene here's the breakdown on which countries have more and which have less corruption: nationmaster.com/graph/gov_cor-government-corruption/AFR. Notice how much better less religious "socialist" countries rate as opposed to pious, conservative ones do. |
USA total market capitalization (in billions) and percentages : |
||||||||||||||||||||||||||||||||||||||||||||||||||||||||||||||||||||||||||||||||||||||||||||||||||||||||||||||||||||||||||||||||||||||||||||||||||||||||||||||||||||||||||||||||||||||||||||||||||||||||||||||||||||||||||||||||||
| Administration | Starting | Ending | Difference | |||||||||||||||||||||||||||||||||||||||||||||||||||||||||||||||||||||||||||||||||||||||||||||||||||||||||||||||||||||||||||||||||||||||||||||||||||||||||||||||||||||||||||||||||||||||||||||||||||||||||||||||||||||||||||||||
| President Carter | from Jan. 1977 = 577 | to Jan. 1981 = 701 | ( up 124 pts. or 21%) | |||||||||||||||||||||||||||||||||||||||||||||||||||||||||||||||||||||||||||||||||||||||||||||||||||||||||||||||||||||||||||||||||||||||||||||||||||||||||||||||||||||||||||||||||||||||||||||||||||||||||||||||||||||||||||||||
| President Reagan | from Jan. 1981 = 701 | to Jan. 1989 = 1654 | ( up 953 pts. or 136%) | |||||||||||||||||||||||||||||||||||||||||||||||||||||||||||||||||||||||||||||||||||||||||||||||||||||||||||||||||||||||||||||||||||||||||||||||||||||||||||||||||||||||||||||||||||||||||||||||||||||||||||||||||||||||||||||||
| President Bush I | from Jan. 1989 = 1654 | to Jan. 1993 = 3017 | ( up 1363 pts. or 86%) | |||||||||||||||||||||||||||||||||||||||||||||||||||||||||||||||||||||||||||||||||||||||||||||||||||||||||||||||||||||||||||||||||||||||||||||||||||||||||||||||||||||||||||||||||||||||||||||||||||||||||||||||||||||||||||||||
| President Clinton | from Jan. 2003 = 3017 | to Jan. 2000 = 13,219 | ( up 10,202 pts. or 330%) | |||||||||||||||||||||||||||||||||||||||||||||||||||||||||||||||||||||||||||||||||||||||||||||||||||||||||||||||||||||||||||||||||||||||||||||||||||||||||||||||||||||||||||||||||||||||||||||||||||||||||||||||||||||||||||||||
| President Bush II | from Jan. 2000 = 13,219 | to Jan. 2007 = 16,346 | ( up 3127 pts. or 24%) | |||||||||||||||||||||||||||||||||||||||||||||||||||||||||||||||||||||||||||||||||||||||||||||||||||||||||||||||||||||||||||||||||||||||||||||||||||||||||||||||||||||||||||||||||||||||||||||||||||||||||||||||||||||||||||||||
| Source :World Market Capitalization, Thomson Data Stream Ian Harnett, Ian [email protected]. Data found by Clarence Swinney ([email protected]) - political research historian since 1991; and formatted as a table by Ray Dubuque. | ||||||||||||||||||||||||||||||||||||||||||||||||||||||||||||||||||||||||||||||||||||||||||||||||||||||||||||||||||||||||||||||||||||||||||||||||||||||||||||||||||||||||||||||||||||||||||||||||||||||||||||||||||||||||||||||||||
as early as 2003, at Bushvsnobel.html. The Republican Party's "base" :
| ||||||||||||||||||||||||||||||||||||||||||||||||||||||||||||||||||||||||||||||||||||||||||||||||||||||||||||||||||||||||||||||||||||||||||||||||||||||||||||||||||||||||||||||||||||||||||||||||||||||||||||||||||||||||||||||||||
|
For some fantastic graphs and data regarding Presidential elections and administrations see Liberal-Insights.org/+Reasonable/PresidentialVote.html
The very best site I know of for keeping up with |
||||
|
See also International graphs :with comparisons of the U.S. with other countries: National Rankings re: prosperity National Rankings re: health care
academy computer service
|
||||
| If someone knows the precise source of the above, please email it to me at the address at bottom of this page. Meanwhile the following are similar sources :
& en.wikipedia.org/wiki/Welfare_state on what is normally meant by the expression "Welfare State". Also, check out Why the leadership of the G.O.P. wants to bankrupt your government. If conservative Republican politicians were as patriotic in reality as they are in their "professions" of patriotism, they wouldn't be content to promote our armed services for others, while consistently avoiding it themselves! Their record is so deplorable that we devote an entire page to Conservative Republican "chickenhawks". "Have you heard that the United States is headed toward socialism? Jonah Goldberg says it is. Alabama Senator Richard Shelby says it is. Phyllis Schlafly says it is. Richard Viguerie says it is. The Republican National Committee says it is. We must be getting pretty close." How close? This is what socialism looks like:  [from http://correspondents.theatlantic.com] | ||||
| Pages : 1 2 of graphs |
Contact  [email protected] There is much more where this came from, at and/or |